The conventional RMP for standardization of FT4 measurements
After these strategic decisions, the C-STFT developed and thoroughly validated an ED ID-LC/tandem MS cRMP for FT4. In 2011 the method was first submitted in publication form for review and approval by the IFCC Scientific Division, then submitted for review to the Journal Clin Chem Lab Med. Once accepted for publication, the IFCC put the cRMP to vote by all its National Society Members. As a result, the published cRMP for FT4 was generally accepted as IFCC endorsed reference method (18). The next step was nomination of the ED ID-LC/tandem MS cRMP for FT4 to the JCTLM. This organization has a system in place to verify whether a RMP is conform with the ISO 15193 standard (19). Also the ISO 17025 and 15195 accredited laboratory at UGent was nominated to become a JCTLM approved reference laboratory (20), (21). These nominations were successful and resulted in listing in the JCTLM Database (4). Currently, the chair of the C-STFT is establishing a network of competent reference laboratories. Candidate laboratories besides her own laboratory are: those from the Reference Material Institute for Clinical Chemistry Standards (ReCCS, Japan) (already involved in the study described in Ref. 18), the Centers for Disease Control and Prevention (CDC, Atlanta, USA) and the laboratory of the Endocrinology Department of Radboud University Medical Center (Nijmegen, The Netherlands). Meanwhile, UGent is working to develop an analogous cRMP for FT3.
The APTM for harmonization of TSH measurements
With regard to developing a statistically valid procedure to calculate the APTM for TSH, the C-STFT started by scrutinizing literature, and was surprised to find that, already decades ago, the potential of the combination of split sample multiple method comparison studies with statistical analysis of the data by principal component analysis (PCA) had been described. These exemplary studies showed that PCA can compare differences and similarities between measurement procedures, provide a so-called composite reference value for each of the measured samples, so that they subsequently can be used as a valid basis for calibration and accomplishment of equivalent measurement results. Indeed, this approach eliminates calibration biases among different measurement procedures. To rehearse and challenge this alternative to harmonization of measurements, the C-STFT did a proof-of-concept study. They applied PCA to existing data from a split-sample method comparison study between immunoassays and an ID-MS-based candidate SI-traceable RMP for serum or plasma insulin (22). The data set was of particular interest because it had been used before to prove the feasibility of SI-based standardization of insulin measurements. The study confirmed not only the validity of the statistical approach based on PCA, but also showed that it results in an equivalent quality as achieved with the RMP approach, in other words can perfectly serve the purpose of a surrogate RMP as conceptually planned by the C-STFT. Later on, the APTM approach was thoroughly elaborated and validated for TSH (23).
The Phase I, II and III method comparison studies
As a result, the C-STFT has now 2 de novo developed reference measurement systems in place, one for standardization of FT4, another one for harmonization of TSH. The cRMP and surrogate RMP were already used in the Phase I, II and III split sample multiple method comparison studies to demonstrate the feasibility of the developed standardization/harmonization concepts. The studies had distinct goals: the Phase I study intended to assess the quality and performance of the thyroid function tests currently in use and to investigate the current status of standardization. The Phase II study was a first proof-of-concept study on demand of the IVD partners. They namely wanted to be sure that a reproducible standardization/harmonization basis would be generated by the C-STFT concepts. In addition, they wanted to verify whether recalibration of the assays by their own in-house recalibration algorithm would result in the same outcome as in Phase I, where only a mathematical recalibration had been used to show the feasibility/success of the concepts. Therefore, in the proof-of-concept study the IVD manufacturers included their master calibrators and did the recalibration against the FT4 data by the cRMP and the TSH APTM themselves. The Phase III method comparison was organized with the focus on investigating the quality of performance and status of standardization of FT4 and TSH assays over the complete measuring range, representing a broad thyroid spectrum. It was also the intention to put special emphasis on the question whether TSH assays are glycosylation blind or specific. Finally, the full impact of standardization/harmonization was investigated. With these purposes in mind, the C-STFT used in the Phase III study samples sourced from clinical settings with patient populations affected by typical disorders in the central regulating circuit between the hypothalamus, pituitary and thyroid gland. The study details are described elsewhere (14), (15), (24), (25). The outcome of the last study is summarized below.
For FT4
The Phase III study showed the performance and standardization status of FT4 assays on clinical samples representing a broad thyroid spectrum. It also showed the feasibility of assay standardization, however, revealed that this will have a huge impact for most of the assays. The current calibration set point of FT4 assays will increase between ~15 to 50% (in the mid- to high concentration range). For example, for a specific sample before recalibration, assay K would report ~10.5 pmol/L, while assay M reports 15.8 pmol/L, afterwards both would report ~19 pmol/L.
For TSH
This study showed the performance and standardization status of TSH assays on clinical samples representing a broad thyroid spectrum. The fact that the correlation of the results of the individual assays with the APTM was excellent, and that the dispersion of the regression residuals was small, gave evidence that either current assays are unaffected by the TSH glycoforms present in the samples, or that the difference in glycoforms were not relevant in the serum samples used. It also showed the feasibility of assays harmonization on the basis of the APTM without dramatic impact, since only 3-4 assays will significantly be affected (1 over the whole concentration range, 2 in the low-, and 1 in the high range). The other assays can be aligned by applying a master equation.
The Phase IV method comparison study – Technical recalibration
FT4
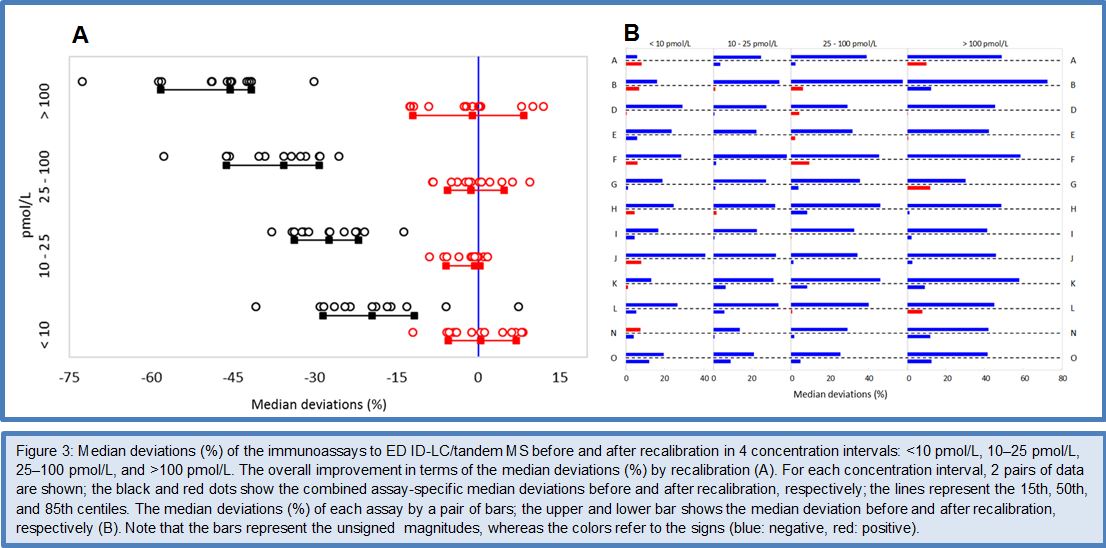
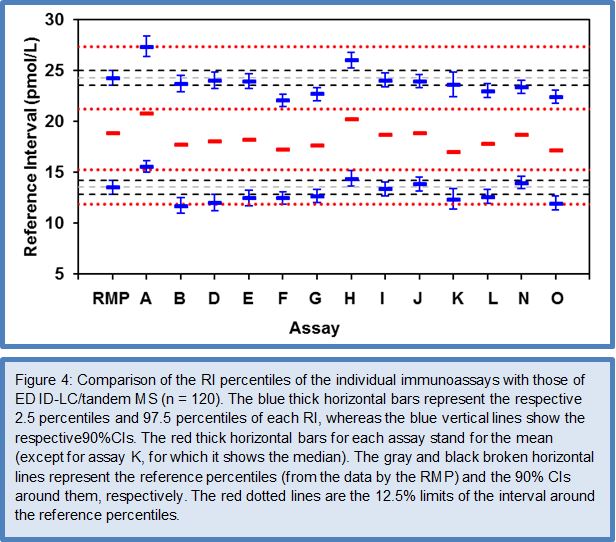
Given the fact that the Phase I to III method comparisons gave sufficient evidence for the feasibility of standardizing FT4 immunoassays by use of the ED ID-LC/tandem MS cRMP, the C-STFT consortium decided in 2014 to proceed to the technical process of standardization in the Phase IV study. However, it was decided that implementation of the standardized assays would have to wait until the involved stakeholders were fully informed/prepared for this step. In practice, the Phase IV study started with sourcing the FT4 standardization panel. This finally comprised 91 clinically relevant samples, which were obtained from apparently healthy but also thyroid-diseased donors (50 eu-, 8 hypo-, 33 hyperthyroid subjects). In this way it was ensured that the standardization panel reasonably would cover the entire thyroid hormone concentration range. The panel samples were measured by the ED ID-LC/tandem MS cRMP for target setting and by the immunoassays which participated in the standardization effort. The method comparison data were subsequently used for recalibration (= standardization) of the immunoassays. This was done by new value assignment of the assays’ master calibrators, which had been included in the method comparison. Once the technical recalibration was completed, another panel of 120 samples from euthyroid subjects (= the reference interval (RI) panel) was used as proof-of-concept by verification whether the RI determined by the cRMP could serve as common basis for the recalibrated FT4 assays. The main outcome of the FT4 Phase IV study is shown in Figures 3 and 4. For a detailed description of the study protocol and results, we refer to (26).
TSH
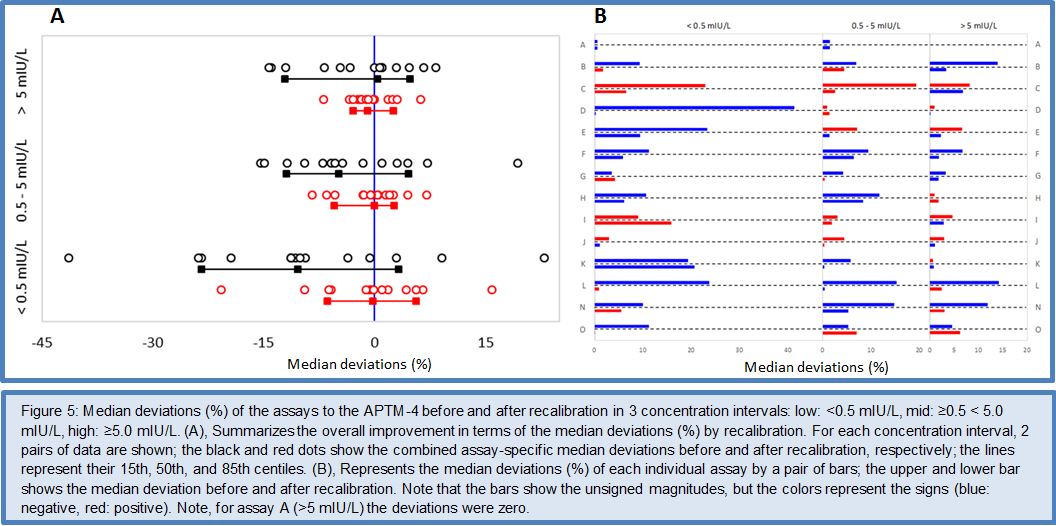
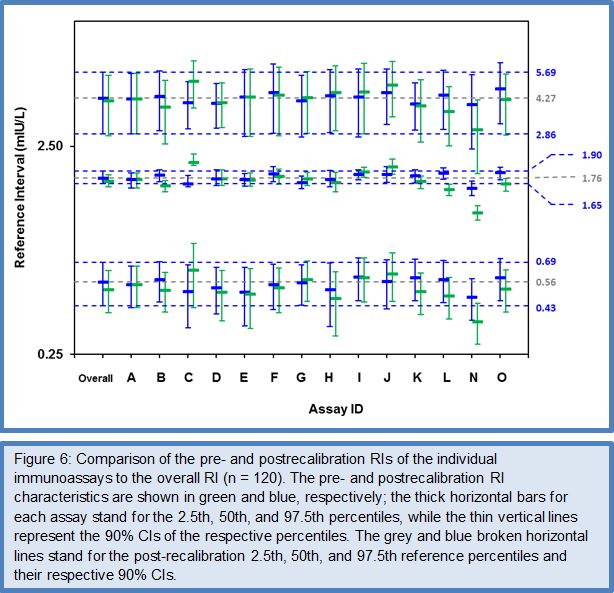
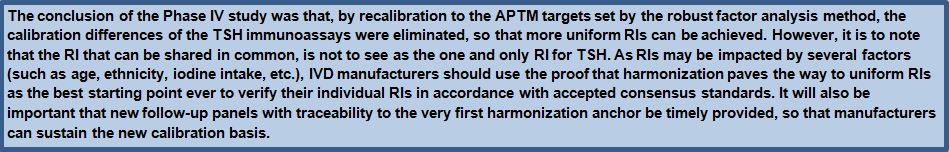
After the favorable conclusions of the Phase I to III method comparison studies on the feasibility of harmonizing TSH assays, the C-STFT consortium also proceeded for this thyroid hormone to the technical recalibration (= harmonization). This was done by conducting the Phase IV method comparison study with a unique harmonization panel comprising 101 samples from 43 eu-, 26 hypo- and 32 hyperthyroid individuals. The samples were value assigned by use of the earlier described statistical method based on robust factor analysis. The targets (for historical reasons called the all-procedure trimmed mean or APTM) then served as a basis for recalibration of the participating immunoassays, similarly as described above for FT4. To ensure the sustainability of this new calibration fixed point for TSH assays, immediately a first follow-up panel (95 samples: 36 eu-, 26 hypo-, 33 hyperthyroid subjects) with full traceability to the harmonization panel was made available. The TSH Phase IV study also investigated the proof-of-concept from measurement of a (RI) panel with the harmonized assays. Figures 5 and 6 represent the main outcome of this study. For a detailed description of the study protocol and results, we refer to (27).
IVD manufacturers who recently joined the C-STFT activities
Since the FT4 standardization and TSH harmonization activities described in Refs. 26 and 27, C-STFT was joined by two new companies, , i.e., Sanyo Chemical Industries (Kyoto, Japan) and Wako Pure Chemical Industries (Osaka, Japan), with their joint venture FT4 and TSH assays (Accuraseed FT4 and TSH). These companies successfully went through the step-up approach, which showed among others the feasibility of standardizing/harmonizing their assays. Consequently, they were provided with the FT4 standardization/TSH harmonization panel for measurement and value reassignment of their master calibrators. After recalibration they also measured the RI panels. The recalibrated FT4 assay had a bias of -2.5% (95% CI: 2.7% resulting in an upper and lower bias limit of 0.2% and -5.2%, respectively). Consequently, like was the case for several FT4 assays which participated in the Phase IV study, the bias did not comply with the 3.3% specification derived from the biological variation concept with 95% confidence (due to the lower limit which exceeded it), however, it met the empirical 10% specification set in Ref. 26. The bias for the recalibrated TSH assay was -1.6% (95% CI: 1.8%), hence both the upper and lower limit at 0.2% and -3.3%, respectively complied with the 7.8% bias specification from the biological variation concept with 95% confidence. With regard to the assays’ TE after recalibration, the FT4 assay did not accomplish the used specification of 13%, since 30% of the differences to the targets for measurements in singleton exceeded the limits, while complying requires that <5% do. For TSH, the assay met the TE specification of 23.8% (exceeded by <5% of the differences).
The data for the FT4 RI panel were normally distributed, which allowed estimation of the RI characteristics with the direct parametric procedure. The deviation of the mean of the RI (19.7 pmol/L) and the 2.5/97.5 centiles [lower centile: 13 pmol/L (90% CI: 12.2 – 13.9 pmol/L); upper centile: 26.3 pmol/L (CI: 25.5 – 27.2 pmol/L)] from the corresponding RI characteristics by ED-ID-LC/MS-MS [mean: 18.9 pmol/L; lower centile: 13.5 pmol/L (90% CI: 12.8 – 14.2 pmol/L); upper centile: 26.3 pmol/L (CI: 25.5 – 27.2 pmol/L)] were within the 12.5% limit set in Ref. 26. The data for the TSH RI panel were not normally distributed, also not after log transformation (P 0.01), which required use of the nonparametric bootstrap procedure for data treatment. The median of the RI was at 1.79 mIU/L (90% CI: 1.67 – 1.91 mIU/L), while the 2.5 and 97.5 centiles were at 0.58 mIU/L (CI: 0.45 – 0.71 mIU/L) and 4.35 mIU/L (CI: 2.90 – 5.80 mIU/L), respectively. In consequence, the RI characteristics were nicely within the 90% CIs of the corresponding characteristics calculated for the overall RI (CI of the median at 1.76 mIU/L: 1.65 – 1.90 mIU/L, of the 2.5 centile at 0.56 mIU/L: 0.43 – 0.69 mIU/L and the 97.5 centile at 4.23 mIU/L: 2.86 – 5.61 mIU/L)] (27).